https://github.com/ohbumjun/GameEngineTutorial/commit/b3c16ce7fa083209accd7c4a5815859c38b931bd
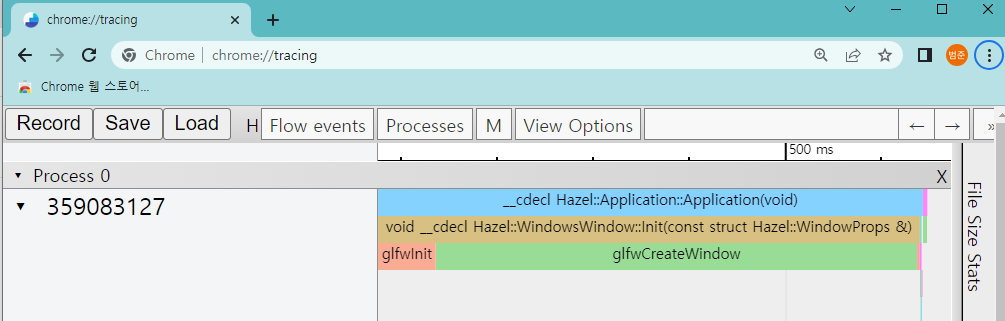
이와 같이 각각의 함수가 얼만큼의 시간을 소요하는지 Visual 적으로 Profiling 하는 System 을 마련해보고자 한다.
    class InstrumentationTimer
    {
    public:
        InstrumentationTimer(const char* name)
            : m_Name(name), m_Stopped(false)
        {
            // 시간 간격을 주기 위해 2번 호출
            m_StartTimepoint = std::chrono::high_resolution_clock::now();
            m_StartTimepoint = std::chrono::high_resolution_clock::now();
        }

        ~InstrumentationTimer()
        {
            if (!m_Stopped)
                Stop();
        }

        void Stop()
        {
            auto endTimepoint = std::chrono::high_resolution_clock::now();

            long long start = std::chrono::time_point_cast<std::chrono::microseconds>(m_StartTimepoint).time_since_epoch().count();
            long long end = std::chrono::time_point_cast<std::chrono::microseconds
            >(endTimepoint).time_since_epoch().count();

            uint32_t threadID = std::hash<std::thread::id>{}(std::this_thread::get_id());
            Instrumentor::Get().WriteProfile({ m_Name, start, end, threadID });

            m_Stopped = true;
        }
    private:
        const char* m_Name;
        std::chrono::time_point<std::chrono::high_resolution_clock> m_StartTimepoint;
        bool m_Stopped;
    };
위의 Class 는 실제 소요된 시간을 계산할 때 사용하는 Class 이다.
기본적으로 Chrono Library 를 사용하는 것을 알 수 있다.
struct ProfileResult
{
    std::string Name;
    long long Start, End;
    uint32_t ThreadID;
};

struct InstrumentationSession
{
    std::string Name;
};

class Instrumentor
{
private:
    InstrumentationSession* m_CurrentSession;
    std::ofstream m_OutputStream;
    int m_ProfileCount;
public:
    Instrumentor()
        : m_CurrentSession(nullptr), m_ProfileCount(0)
    {
    }

    void BeginSession(const std::string& name, const std::string& filepath = "results.json")
    {
        m_OutputStream.open(filepath);
        WriteHeader();
        m_CurrentSession = new InstrumentationSession{ name };
    }

    void EndSession()
    {
        WriteFooter();
        m_OutputStream.close();
        delete m_CurrentSession;
        m_CurrentSession = nullptr;
        m_ProfileCount = 0;
    }

    void WriteProfile(const ProfileResult& result)
    {
        if (m_ProfileCount++ > 0)
            m_OutputStream << ",";

        std::string name = result.Name;
        std::replace(name.begin(), name.end(), '"', '\'');
        /*
        'cat' – the category for this event.Useful when doing larger grouping(eg "UnitUpdates")
        'name' – the name of this event(eg 'PathingUpdate')
        'pid' – the processor ID that spawned this event
        'tid' – the thread ID that spawned this event
        'ts' – the processor time stamp at the time this event was created
        'ph' – the phase or type of this event
        'args' – any programmatic metadata that's attached to this event
        */
        m_OutputStream << "{";
        m_OutputStream << "\"cat\":\"function\",";
        m_OutputStream << "\"dur\":" << (result.End - result.Start) << ',';
        m_OutputStream << "\"name\":\"" << name << "\",";
        m_OutputStream << "\"ph\":\"X\",";
        m_OutputStream << "\"pid\":0,";
        m_OutputStream << "\"tid\":" << result.ThreadID << ",";
        m_OutputStream << "\"ts\":" << result.Start;
        m_OutputStream << "}";

        m_OutputStream.flush();
    }

    void WriteHeader()
    {
        m_OutputStream << "{\"otherData\": {},\"traceEvents\":[";
        m_OutputStream.flush();
    }

    void WriteFooter()
    {
        m_OutputStream << "]}";
        m_OutputStream.flush();
    }

    static Instrumentor& Get()
    {
        static Instrumentor instance;
        return instance;
    }
};
우리가 사용하는 Visual Profiling 은 Chrome/testing 을 사용하고
해당 사이트는 특정 format 의 Json 파일을 요구한다.
우리가 얻어낸 정보를 json 파일로 변환해주는 클래스이다.
Timer Class, Instrumentor 클래스 모두 프로그램 전체에서 하나의 Instance만 있으면
되기 때문에 static 변수를 활용할 것이다.
#if HZ_PROFILE
    #define HZ_PROFILE_BEGIN_SESSION(name, filePath) ::Hazel::Instrumentor::Get().BeginSession(name, filePath);
    #define HZ_PROFILE_END_SESSION() ::Hazel::Instrumentor::Get().EndSession();
    #define HZ_PROFILE_SCOPE(name) ::Hazel::InstrumentationTimer time##__LINE__(name);
    // __FUNCTION__ : name of function
    // __FUNCSIG__   : name 뿐만 아니라 arg 를 통한 구분
    #define HZ_PROFILE_FUNCTION()  HZ_PROFILE_SCOPE(__FUNCSIG__);
#else
위와 같은 매크로를 정의한다.
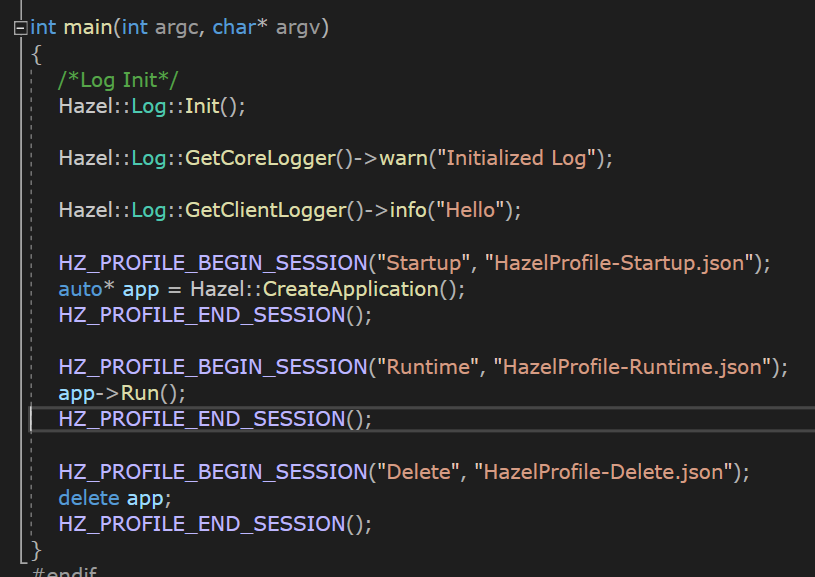
1) Json 파일로 만들어내고자 하는 영역의 시간과 끝을 begin session, end session 매크로로 세팅한다.
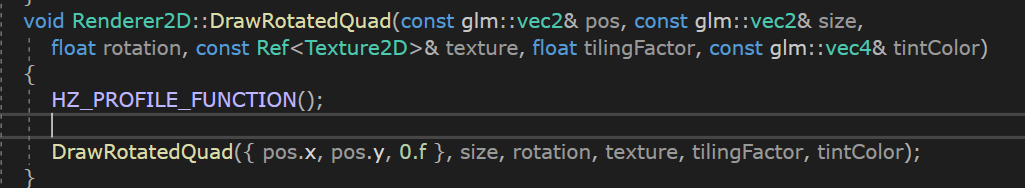
2) 실제 시간을 calculate 하고자 하는 함수에 HZ_PROFILE_FUNCTION 을 세팅하게 되면, 해당 함수 범위 내에서
Timer Class 객체를 만들어서 소요된 시간을 json 에 기록한다.

완료시 위와 같은 이미지 형태를 얻을 수 있다.
'게임엔진 > 크로스플랫폼 : HazelEngine' 카테고리의 다른 글
| 230514 자체 엔진 개발 : Batch Rendering (0) | 2023.05.31 |
|---|---|
| 230512 자체 엔진 개발 : DrawRotated Quad (0) | 2023.05.31 |
| 230508 자체 엔진 개발 : Renderer2D (0) | 2023.05.26 |
| 230506 자체 엔진 개발 : Resize (0) | 2023.05.09 |
| 230504 Hazel GameEngine : CameraController , Zoom 적용하기 (1) | 2023.05.08 |